



Britain has almost run out of taxpayers, or at the very least, it’s slowly running out of people who pay enough taxes to plausibly finance the state. If a household pays more in tax than it receives in benefits during a given financial year, it is traditionally described as a ‘net contributor’ household. In 2023–24, the ONS reported that 46.7 per cent of people in Britain lived in such households – fewer than half.
Whilst dispiriting, that figure is also somewhat flattering. The ONS’s methodology accounts for direct and indirect taxes against cash benefits and selected services, such as health and education. Crucially, it doesn’t allocate all state spending to taxpayers. Some households therefore appear to be net contributors even though they would not qualify under a full-cost calculation.
Another issue is the focus on households as the basic unit of account. This means that babies in sufficiently high-earning households inherit their parents’ contributor status.
To administer a more accurate test, the focus should be on the individual, not the household. Moreover, to better understand the state of fiscal affairs, we should consolidate all state spending when we make these evaluations and clarify what is genuine tax and what is a state transfer.

For instance, civil servants and NHS employees pay tax on paper, but their salaries are paid from public funds, so the payment of wages and the collection of tax and National Insurance are all internal public sector transfers. Public sector employees cannot be net contributors, by definition, as they are net recipients of funds from the state.
The calculation assigns each resident an equal share of total managed expenditure, covering administration, defence, capital spending and debt interest, as well as spending financed by borrowing. Against this, it counts income tax, employee and employer National Insurance, council tax and consumption taxes attributable to the earner. This method yields a per-resident bill in 2025–26 of about £19,600, with a corresponding break-even salary of £42,600.
By this measure, we see that in 1998, about 43 per cent of British earners paid sufficient tax to cover the Government’s average per-capita spending. During Covid, that figure fell to an absolute low of circa 20 per cent, then by 2025 recovered modestly to 26.6 per cent.
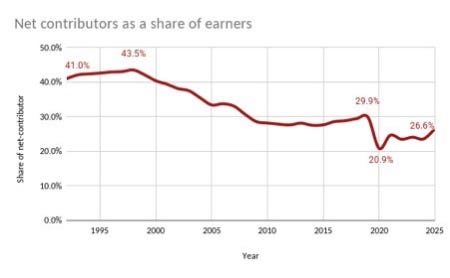
So what caused this dramatic decline? First, it is the growing share of people who work in the public sector. Public sector workers now account for about 18 per cent of employment, with the Civil Service growing its headcount by about a third in the past decade. Each new public sector employee creates a new fiscal net recipient and reduces the pool from which the Government can draw new funds. It also involves a transfer of workers into a lower-productivity sector, which affects overall capacity for economic growth.
The main cause, however, is that public spending outpaces the private economy which sustains it. Britain is older and more burdened by fiscal commitments made in an era when economic growth looked easy. The state pension alone ate 5 per cent of GDP in 2024–25, and with a combination of demographic pressures and the triple lock, it is set to continue increasing, uncapped. Only healthcare costs more, and it faces the same unhappy combination of rising demand and weak productivity.
Successive British Governments have maintained spending through heavy borrowing and shown little appetite for reining it in. They have repeatedly postponed difficult choices over spending while relying on future taxpayers to service the resulting debt. Their main strategy for raising revenue has been fiscal drag, combined with repeated adjustments to existing taxes that can discourage economic activity and make the position still less sustainable.
Being a net contributor should now earn a medal for fiscal virtue. Net contributors are becoming a dying breed, and the Government has no credible plan to put the public finances on a sustainable path. Expect their share to keep falling until creditors finally force a reckoning.
I had a letter published in the FT last February pointing out something similar: one-third of adults do not pay any income tax and half receive more in benefits than they pay in taxes ('It looks as though turkeys are voting for Christmas' 13/02/26; a tag line induced by a reported increase in those voting for less taxes). The proportion not paying any direct tax on income is crucial here because of peoples perceptions of getting a free ride. More than 50% and the country would be in free fall.
Your methodology is a form of double counting. If the state did not take or print the money it is likely many (but not all) jobs, like doctors, would still exist, providing value, economic activity and tax.
So a doctor can be a net economic contributor, regardless of funding source. This is good and a natural argument against the ‘but if NHS disappeared there would be no healthcare’ argument.